Abstract
Any civilisation depends upon infrastructure systems including water, energy and transportation. Mature economies have to cope with ageing infrastructure assets, whilst emerging economies are adding to their stock of infrastructure assets at a remarkable rate. In this article, we explore the multiple factors that are driving expectations for infrastructure services, in developing as well as developed nations. The processes of digitisation and electrification are leading to increased interdependence between infrastructure networks, whilst resource scarcity (e.g. water, energy) is also intensifying interdependencies. The UK Infrastructure Transitions Research Consortium has developed a national infrastructure system model (NISMOD) to simulate infrastructure system performance and inform difficult decisions about future prioritisation of national infrastructure.
The many societal needs for infrastructure services
In this article we focus upon networked national infrastructures: energy, transport, digital communications, water (including water supply, waste water treatment, drainage and flood protection) and solid waste. We recognise these as being complex socio-technical systems, in that to function they require coordination of many technological artefacts along with the human systems that plan, deliver, operate and maintain these artefacts. Some definitions of infrastructure extend to include social infrastructure i.e. schools, hospitals, prisons, banks and so forth. In this article we restrict ourselves to the categories of networked economic infrastructure that have just been mentioned. These categories of infrastructure have traditionally been dealt with in separate silos by government and industry. Governments have had separate ministries of energy, transport and so on, and industries (and their consultants and regulators) are organised along sectoral lines. It is only relatively recently that infrastructure has begun to be considered as an over-arching category by governments and the finance sector. In government this movement has been reflected by the setting up of specialist infrastructure units, including Infrastructure Australia, New Zealand’s National Infrastructure Unit and the National Infrastructure Commission in the UK.
There are several drivers of recent political attention to infrastructure systems-of-systems. Here we review some of the main developments.
National security and natural catastrophes: The terrorist attacks of September 11 2001 spurred a huge amount of new activity relating to national security, including relating to infrastructure systems [1]. Coming at roughly the same time as developments in network science [2], there has been a rapid flourishing of understanding of the behaviour, and notably the failure, of infrastructure systems. The arrival of extremely damaging hurricanes, notably Katrina in New Orleans, and Sandy in New York and neighbouring states, has also highlighted infrastructure vulnerability. The impacts of these events, and of the Fukushima Daiichi nuclear disaster (which followed an earthquake and tsunamis), reverberated around the world, leading to reconsideration of infrastructure resilience in countries far from where the disasters occurred. Weather-related disasters like Katrina and Sandy also raised awareness of the potential impacts of climate change, including increasing sea levels [3] and the possibility of changing hurricane frequency and severity [4]. Partly as a consequence of these disasters, London reviewed the standard of its protection against storm surge flooding [5] and flood risk management in the Netherlands was comprehensively reviewed [6] in order to enable adaptation to future changes.
Disasters do not need to be on the catastrophic scale of 9/11, Katrina or Sandy to demonstrate the fragility of infrastructure networks and the often unforeseen consequences of interdependence. A series of floods in the UK since 2007 [7] has illustrated how single points of failure (like the electricity substation in Lancaster that flooded in 2015 [8]) can result in disruption – sometimes life-threatening – for tens of thousands of utility customers. A bridge failure in the coastal town of Whitehaven in northern England deprived the town’s residents of electricity, gas and telephony because the bridge carried wires and pipes that supplied those services. A flood in York disrupted the operation of police and hospitals as far away as Newcastle because the telecommunications system was knocked out by the flood.
Thanks to increasing understanding of the processes of interdependence between infrastructure networks (see below), we now have growing capability to simulate failure, analyse risk and prioritise interventions to build resilience.
Deterioration: The American Society of Civil Engineers gave America’s infrastructure a D+ grade in its 2017 report card. The report asserted that there was a backlog of $2trillion of maintenance and renewal through to 2025. This growing maintenance commitment is not surprising given that so much infrastructure was built in the pre- and post-Second World War periods, so is now reaching the end of its life. Meanwhile the costs of weaving infrastructure through dense urban settings has increased, whilst infrastructure spending as a % of GDP has declined.
In Britain, where much infrastructure was built during the industrial revolution, the challenges are even greater. London’s main sewer system was built in the 1850s and 1860s. Most of Britain’s railway embankments and cuttings were built before the advent of modern engineering standards of design and construction. Information on these structures, and masonry arch bridges, is scarce and usually requires invasive investigations to acquire. Remediating the whole stock of assets will be enormously costly.
Fiscal stimulus: The global financial crisis of 2007/8 threw economies into recession. Governments and central banks tried many policies to mitigate the impact. Infrastructure investment is a venerable form of fiscal stimulus, an oft-cited example being the programme of public works in Roosevelt’s New Deal. After the financial crisis President Obama announced $105billion of infrastructure investments. Infrastructure featured visibly in Prime Minister Gordon Brown’s 2009 policy Building Britain’s Future. Actually, whilst government expenditure can to some extent be rapidly absorbed in programmes to deal with maintenance backlogs, large new infrastructure has such a long lead-time that it is not very effective as a fiscal stimulus. Accelerating programmes that are already on the drawing board can add unacceptably to the costs.
Productivity: A rather more compelling economic argument for infrastructure investment has come from introspection in several advanced economies about declining rates of growth in productivity. It is no coincidence that Australia’s infrastructure unit is hosted within the influential Productivity Commission. Though the economic evidence of the returns to infrastructure investment is patchy [9], there do seem to be positive returns in particular for investments in transport and digital communications infrastructure. Physical and digital connectivity enables trade and workforce mobility; it promotes agglomeration and innovation. The arguments for infrastructure investment in the UK have increasingly rested on arguments of increasing productivity and competitiveness.
Social inclusion: It seems that infrastructure investment to promote economic growth and competitiveness yields greatest returns where there is already high growth potential. Completion of London’s Jubilee Line Extension to the new docklands financial district has yielded enormous economic benefits in enabling commerce and travel to work. But these investments have also exacerbated regional inequalities between the Southeast of England and the rest of Britain. Infrastructure is regarded as a potential mechanism to help to rebalance economic geography, with a growing emphasis upon the infrastructure needs of the north of England – though it is not clear whether high speed rail connectivity will benefit the north or add more wealth to the south. Similar arguments about using infrastructure investment to stimulate deprived regions have been in America’s rust belt [10]. Related political motives underlie policies to promote access to high-speed broadband in rural areas, when it is seldom economical for telecoms firms to lay fibre in these places.
Sustainability: Infrastructure involves long-term commitments. Once built, infrastructure can be very costly to modify or remove. Infrastructure can even have a legacy that lasts beyond the long lifetime of built facilities: transport locks in patterns of spatial development, whilst power plant sites often end up being used for several successive generations of plants. Choices made about infrastructure can be fundamental for sustainability, in a wide range of senses: environmental, social and economic. From an environmental perspective, energy and transport infrastructure are the largest sources of carbon emissions to the atmosphere and of air pollutants that are harmful to the health of people living nearby. Dams and inland waterway navigation can disturb sensitive aquatic environments. On the other hand, infrastructure has made huge contributions to restoring the environment, for example through modern waste water treatment facilities that avoid pollution of rivers and coastal waters, and solid waste treatment that recycles and/or extracts resources (including energy) from solid waste. From a social perspective, infrastructure (notably transport and digital communications) enables participation in society, promotes the spread of ideas and access to information that is needed to hold governments to account. Analysis demonstrates that the state of a nation’s infrastructure influences all of the Sustainable Development Goals, specifically 112 of the 169 targets [11].
The developing country perspective: Though most of the preceding discussion has addressed the issues of advanced economies with a large and ageing stock of reasonably well functioning infrastructure, the greatest infrastructure challenges are to be found in low and middle income countries. At present 2.5 billion people lack basic infrastructure services. One estimate suggests that $45-60 trillion of infrastructure investment is required to address these needs [12]. Investment is taking place at a staggering rate. China invested 8.5% of GDP in infrastructure between 1992 and 2011. The China-Pakistan Economic Corridor involves $62 billion of Chinese investment by 2030 in energy, transport, ICT, and industry, which is more investment in infrastructure than has occurred since the creation of the state of Pakistan. These investments will lock in patters of development for many years to come, and will also leave a burden of debt for future generations. Crucial decisions will be made over the next few years that will lock in development pathways for exploding urban populations and economies in transition. Notwithstanding these impressive infrastructure investments in emerging economies, in least developed countries, all too often, infrastructure investments are regarded as being too risky or are captured by political interests. Incomplete or inappropriate infrastructure investments become a drag on growth. Lessons are being learnt from the failures of the past, but the challenges of the future are intensifying.
Interdependencies in infrastructure systems-of-systems
Infrastructure networks have been designed and evolved as sector-specific entities: electricity, gas, road, rail, digital communications and so on. They inevitably have interdependencies between each other, but these have not, until relatively recently, attracted a great deal of attention. One network operator (e.g. a water utility) has tended to assume that the networks upon which it is dependent (e.g. electric power, transport for the delivery of chemicals) will continue to function come-what-may. That optimistic assumption has been shattered by a series of damaging and disruptive incidents. Though by no means the most disruptive, the well-documented account of flooding of an electricity substation in Lancaster in December 2015 [8] is revealing in that it demonstrates how rapidly all societal functions can cease these days without electric power for information and communications technologies. This points to a process of rapid technological convergence upon electricity as the dominant energy vector and digital connectivity being essential for all infrastructure networks to function. These are not the only interdependencies, but they are the most ubiquitous and are becoming reinforced by the dominant direction of technological change, towards electrification (in part motivated by the desire to decarbonise the power sector) and digitisation. Other significant forms of interdependence include the dependence of most thermoelectric power plants upon water for cooling, and the dependence of practically all infrastructure upon transport networks (mostly roads) to transport workers to infrastructure sites, even during catastrophic events.
Interdependencies also bring opportunities, for example by using the batteries in electric vehicles to store electricity from renewable energy supplies and better match electricity demand with supply. Risks of water shortage in many parts of the world mean that there are increasing efforts, led by countries like Singapore and Israel, to ‘close the urban water cycle’ by directly reusing ‘waste’ water in sewage for urban and agricultural water supplies. There is also growing interest in the ways in which green infrastructure (like green spaces and wetlands in urban areas) can substitute for ‘grey’ infrastructure, often by providing multiple services like sustainable urban drainage, purification of waste water and cooling urban areas (through shade and transpiration).
These interdependencies influence every-day planning for infrastructure investment and operation, and they influence infrastructure performance during extreme events. One set of crucial imponderables for energy system planners is how many electric vehicles there will be in the future, when and where they might need to be charged and whether they can be used as battery storage devices at times of excess renewable energy supply. Another set of questions relates to the growing need for digital infrastructure to service transport technologies like autonomous vehicles. Planning one infrastructure network in isolation will overlook these crucial interdependencies. The framework set out below is designed to explicitly and conveniently incorporate quantified understanding of interdependencies in a system-of-systems methodology.
A framework for infrastructure systems-of-systems analysis
The Infrastructure Transitions Research Consortium (ITRC) is a consortium of seven of the UK’s leading universities which has been working since 2011 to develop, test, demonstrate and deliver methodology for national infrastructure assessment (NIA). The ITRC was backed by £4.7 million of funding from the UK’s Engineering and Physical Sciences Research Council and in 2015 was awarded a further £5.3 million to continue the research programme through to 2020. The ITRC has adopted a ‘system-of-systems’ approach to infrastructure, promoting cutting edge research on the interdependencies between the following infrastructure sectors: energy (electricity, gas), transport (road, rail, ports, airports), digital communication (fixed, mobile, satellite), water (supply, waste water treatment, drainage, flood protection) and solid waste. The assessment methodology is depicted in the diagram shown in Figure 1.
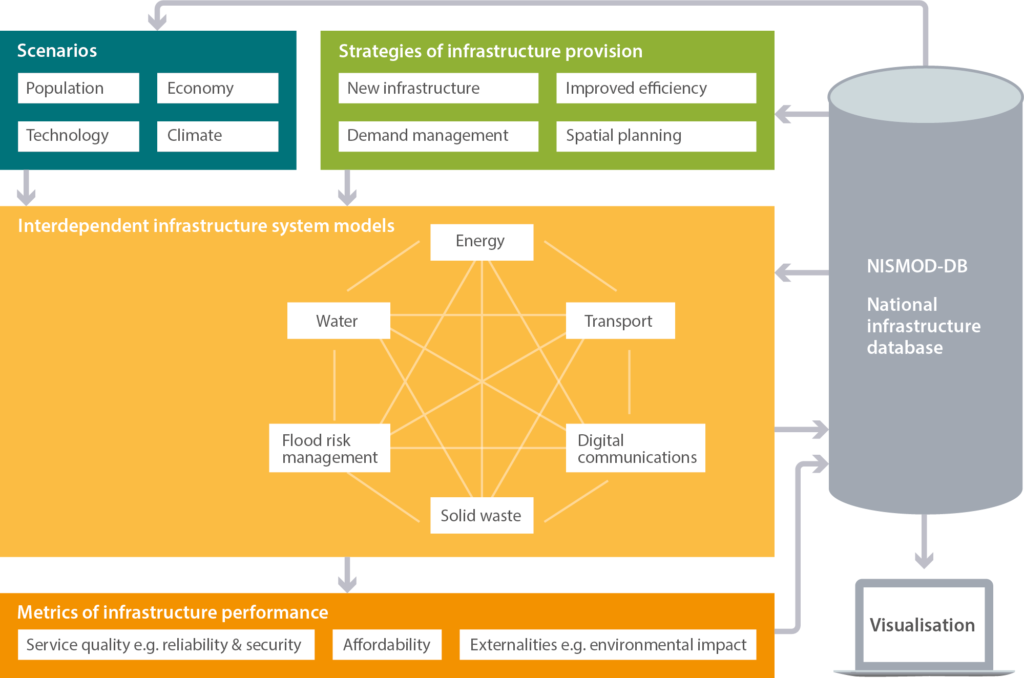
Figure 1: Schematic overview of the use of NISMOD for national infrastructure assessment(adapted from [13])
The system-of-systems framework shown in Figure 1 uses scenarios (top left box) to explore uncertainty in a range of possible futures: the global and national economy; population/demography at national and local scales; climate change; technological development. By examining a wide range of possible scenarios, we can test the sensitivity of infrastructure policies and plans to different possible future states of the world. These scenarios explore the possible range of contextual factors that are largely outside the control of decision makers responsible for national infrastructure. Of course there are feedbacks between the infrastructure system and these factors, notable in terms of regional economic development: provision of infrastructure can stimulate the economy, provide new employment opportunities and hence change where people live. These feedbacks are important to recognise but are also much more difficult to quantify [14] – attempting to model them would introduce additional complexity that for the time being we consider to be unwarranted. We prefer to explore the possible impacts of infrastructure investment on regional economies by using scenarios that test the possibility of additional growth being stimulated by infrastructure provision.
Alongside scenarios, our framework explores one or more infrastructure strategies. Strategies are sequences of infrastructure investments and policy/regulatory interventions that are intended to modify demand for, or provision of, infrastructure services. Strategies must be sufficiently adaptable to cope with uncertain scenarios, for example of population growth. On the other hand, a national infrastructure strategy must give a clear sense of direction about what policies and investments need to be implemented, where and when. The balance between supply-side and demand-side interventions depends on the circumstances and the availability of technologies. Over-provision of new infrastructure (supply-side) can result in infrastructure being under-utilised or resources being used inefficiently. This has stimulated increasing interest in demand-side instruments like pricing (e.g. congestion charging) or regulation to mandate efficiency standards (e.g. for electric appliances). However, these are not cost-free and can require strong political commitment in the face of resistance by infrastructure users.
Scenarios and strategies provide the boundary conditions for the coupled system modelling depicted in the centre of the diagram in Figure 1. NISMOD runs in a simulation mode i.e. for a given set of input conditions (scenarios and strategies) the coupled system models simulate system performance and compute a series of metrics through the simulation period (typically decades into the future) which can be used to evaluate system performance (see below). NISMOD also keeps track of all of the significant interdependencies between infrastructure sectors. Though there are many interdependencies, from an infrastructure assessment and planning perspective, the interdependencies that matter most are when (i) demand for one infrastructure sector is highly correlated with demand for another (e.g. domestic demand for water and energy) and/or (ii) when one infrastructure sector can potentially consume a significant proportion of the capacity of another, notably in power generation, which is responsible for 40% of non-tidal surface water abstractions [15]. Another instance of the latter type of interdependence would become critical if there were to be largescale uptake of electric vehicles, which could eventually use more than 15% of electricity generation in 2050.
We have built two versions of our NISMOD national infrastructure system model. NISMOD1 is described in our 2016 book [16] and each component is briefly summarised in Table 1. Infrastructure and scenario data are held in a shared national infrastructure database, NISMOD-DB. That rigorous structure enables each combination of scenarios and strategies to be accessed and scrutinised. Visualisation functions enable presentation of maps, time series and other graphics. Additionally optimisation routines enable combinations of interventions to be developed that meet specified objectives or are subject to given constraints. NISMOD1 has now been widely used for analysis of the future of UK national infrastructure, including Infrastructure UK’s National Infrastructure Plan [17] and the recently completed UK National Infrastructure Assessment [18]. NISMOD1 couples national-scale models of the energy system, a high level model of multi-modal transport, a model of municipal water supplies and a spatially resolved model of solid waste treatment facilities. NISMOD1 has been converted to a parallel computing environment and has accompanying visual reporting tools.
| Module | Brief description | Interdependence represented |
|---|---|---|
| Population projections | ONS population projections extended to Local Authority District scale | Consistent scenarios are used for all infrastructure sectors. |
| Economic projections | Cambridge Econometrics multi-sectoral model of the UK economy | |
| Climate projections | UKCP09 climate projections and Future Flows projections of GB river flows | |
| Technological projections | Factors for calculating infrastructure demand in each sector include the effects of technological and behavioural change. | |
| Strategies for infrastructure provision | Strategies can be programmed as (i) a pre-determined list of infrastructure investments and/or policy interventions (ii) a set of rules that implement investments/interventions subject to given criteria or (iii) an optimisation problem that maximises/minimises an objective function subject to constraints. | Coherent strategies are developed across infrastructure sectors. |
| Energy systems | Model GB electricity supply and transmission, coupled with model of gas storage and transmission | Electricity demand from electric vehicles, rail electrification and information/communications technologies |
| Transport systems | Road and rail passenger demand estimated a Local Authority District scale. Congestion estimated at inter- and intra- zone scale. Passenger and freight projections for ports and airports. | |
| Digital communications | Fixed and mobile connectivity analysed for Local Authority Districts, based upon population density, socio-economic status and topography (for mobile). | |
| Water supply | Demand for public and industrial water supply estimated for Water Resource Zones. Surface water availability from Future Flows; groundwater based one existing supplies. Simulation of storage, transfers and other sources (e.g. desalination) | Demand for cooling water from thermo-electric power generation |
| Waste water | Projection of domestic sewage based on population projections. Analysis of waste water treatment plant capacity. | |
| Flood protection | National analysis of risk from river and coastal flooding. Flood defence investments reduce flood risk. | |
| Solid waste | Projections of municipal solid waste arising calculated at the Local Authority District Scale and allocated to collection services and treatment, recycling and/or disposal infrastructure | Energy from waste (incineration and biogas) |
| Metrics of infrastructure performance | Capacity margin (infrastructure use / available capacity, averaged spatially), total service delivery, cost (capital operation) and greenhouse gas emissions calculated for each infrastructure sector; plus other sector-specific metrics. | Consistent metrics used across infrastructure sectors |
| Database | National infrastructure database containing all infrastructure asset data and simulation model inputs and outputs | |
| Visualisation | Maps, graphs and other statistical tools, coupled with the database. | |
|
See Figure 1 for colour coding
|
||
NISMOD2 integrates newly developed mapping and optimisation of the nation’s digital communications network, along with high resolution modelling of urban drainage infrastructure. The new water model includes all water users (in the power sector, agriculture and industry, as well as public water supplies). The transport model is much higher resolution, including a full multi-model origin-destination matrix. NISMOD2 also includes a sophisticated new model integration package, which manages the time-step integration of the coupled simulation models and also interfaces with different approaches to developing infrastructure strategies of increasing complexity: from the simplest pre-specified investment strategies that answer ‘what-if’ questions, through to multi-objective optimisation routines that can be used to explore trade-offs between different performance objectives for infrastructure.
There are many objectives for infrastructure systems. One organising principle is based on ‘the trilemma’, which is a well-known framing in the energy sector. The concept of the trilemma articulates how decisions regarding energy systems involve trading off between: (1) security of supply, (2) affordability and (3) carbon emissions. The trilemma can, we believe, be generalised to all infrastructure, in which decision making involves navigating three categories of objectives:
- The accessibility and quality: This relates to the quality of infrastructure services for infrastructure users. In places where access is not universal (e.g. in many parts of the developing world) access is a first order metric for infrastructure, but reliability (i.e. for what proportion of the time does the infrastructure actually work) can be equally important. There are other availability-related metrics e.g. bandwidth and latency for digital communications networks. For transport networks, journey time is of utmost significance alongside the reliability of journey times. Safety and comfort are other quality-related factors for passengers.
- Affordability: Infrastructure services are paid for through a variety of different types of user charges as well as general taxation. Because infrastructure is highly capital intensive, there are always delicate judgements to be made about how the burden of capital expenditure is paid for over the life of the assets, as well as financing an appropriate level of maintenance expenditure to maximise the benefits of the assets. There are particular questions of affordability for least well-off households who struggle to afford tariffs for basic infrastructure services like energy and water.
- Environmental and social externalities: The ways in which infrastructure impacts, and helps to protect, the environment have already been mentioned. These benefits are seldom achieved cost-free. European water utilities have invested extensively in waste water treatment in order to achieve the improvements in river and bathing water quality that have been observed in the EU in recent decades. Whilst renewable energy offers pollution-free supplies often with practically zero marginal cost, the capital costs of new supply facilities and necessary adjustments to transmission and distribution infrastructure (including the introduction of storage) can be high. Mitigating the effects of transport infrastructure on environmentally significant habitats (e.g. by tunnelling), can add significantly to the cost of projects, as can the need to mitigate, or compensate for, the effects on local communities.
Decision making about infrastructure involves navigating these trade-offs on a range of spatial and temporal scales: where to route a new transport link; whether to mandate a universal service obligation for broadband connectivity? It is not the role of an analyst to prescribe where decision-makers should position themselves with respect to these trade-offs. Modelling with a tool like NISMOD enables the trade-offs to be exposed and quantified, so that decision makers understand the implications of their choices. Simulation modelling also enables exploration of sensitivity to future uncertainties, such as population growth and economic change. By exposing these uncertainties, it may be possible to identify strategies that perform acceptably well over a wide range of possible futures i.e. they are robust to uncertainty.
NISMOD has been developed for the UK, but is receiving increasing attention internationally. A recent study in Caribbean island state of Curacao demonstrated how infrastructure system-of-systems modelling can be used to inform investment prioritisation in a country whose needs and economic development is very different to the UK [19]. The analysis considered Curacao’s options for energy, water, solid waste, wastewater and transport infrastructure, highlighting ‘quick wins’ that can deliver benefits in the next few years (like construction of waste-to-energy facilities and addressing leakage and wastage in water supplies) as well as setting out longer-term options. The risks of sea level rise and storm flooding have been assessed on the road network and on critical buildings, such as health or education. Minister of Traffic, Transportation and Urban Planning, Zita Jesus-Leito, stated: “Our infrastructure is vital for the functioning of Curacao today and its future success. Therefore, it should be optimised, efficient and resilient. In that context, cross-sectoral long-term planning is essential for maximising the full potential of our island for the benefit of all its people.” Conducting analysis in relatively data-scarce situations on a short timescale has been challenging, but global datasets from remote sensing and crowd sourcing, combined with good stakeholder support within countries, are making this type of analysis increasingly feasible.
Modelling the risks associated with infrastructure interdependencies
In the preceding section we have explained how interdependencies can be incorporated in long-term planning of infrastructure systems. In that context, interdependencies are significant if there are major flows of resources (e.g. electricity, water) from one sector to another, on a scale whereby omitting these fluxes would result in inaccurate planning assumptions. We have also considered interdependencies in final demand, so for example an increase in population would be expected to drive upward pressure on energy and water usage.
Some of the greatest concerns about interdependency derive from the potential disruptive effects of interdependence during natural catastrophes or security breaches. Understanding the nature or these interdependencies tends to require much more detailed information than for long-term planning purposes. In this context interdependencies are often categorised as follows:
- Geographic (two or more systems are co-located in physical space)
- Physical (a physical output from one system is a necessary input to another)
- Cyber (information produced by a system affects the operation of another)
- Human (shared dependencies on people e.g. workers, organisational or social systems)
Considering geographical interdependencies, it is necessary to know the precise location of individual assets in relation to the hazards to which they are exposed e.g. are the assets in a floodplain? Analysis of the likelihood of failure of a given asset, given a particular hazard scenario such as a flood, involves understanding of the geometry of the asset (e.g. its elevation relative to the flood level), its condition and function. Though comprehensive analysis at a national scale is still some way off, significant elements of the analysis are already in place. For example, by interrogating network data from electricity transmission and distribution network operators in the UK, and using statistical techniques to fill in missing data, it has been possible to develop the full electricity network hierarchy for Great Britain and the dependence of most other infrastructure assets on that network (Figure 2). Our analysis of rail bridge failures due to foundation scour at river crossings has used a unique dataset of 100 bridge failures over the period 1830-2003, to estimate the fragility of bridges in river floods [20]. We also estimates the number of infrastructure customers who are dependent upon any infrastructure asset, using hours of customer disruption as a common metric across infrastructure sectors. Using source-sink relationships between supply points and users, and modelling the amount of disruption during a very large number of scenarios of network disruption, taking account of the potential for flow rerouting, it is possible to estimate how many customers might be disrupted in hazard scenarios of a range of different severities.
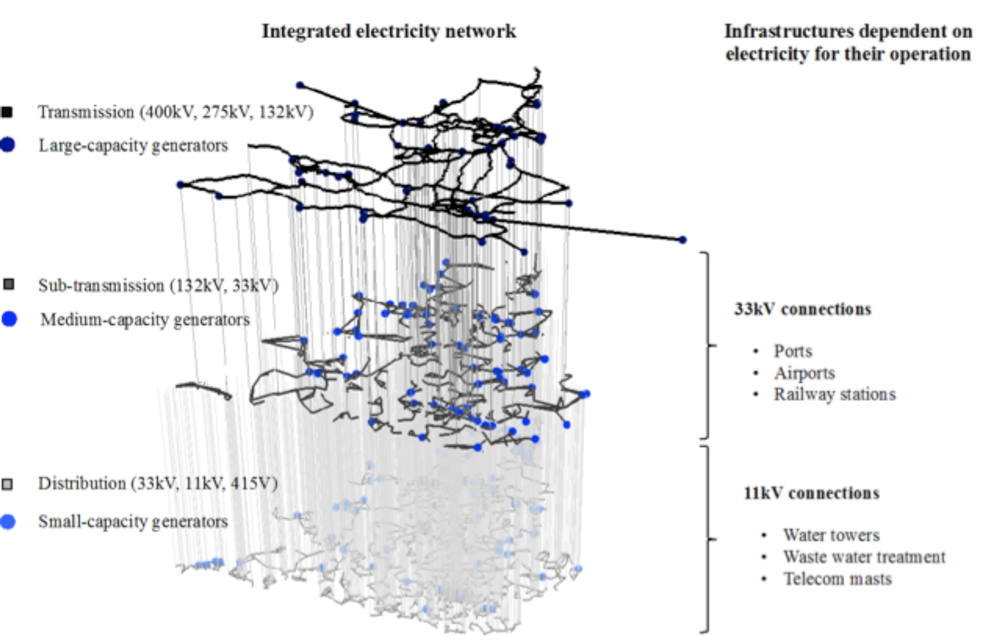
Figure 2: Electricity transmission and distribution model for Great Britain, with infrastructure interdependencies.
Analysis of network vulnerabilities and customer disruptions helps to identify ‘hotspots’ of vulnerability in the network [21]. The next step is to use this information to prioritise interventions that increase resilience. The business case for intervention to increase resilience rests on the comparison of the cost of the intervention with the value of the losses that are expected to be avoided. We have, for example, undertaken a version of this cost-benefit calculation for electricity sub-stations, exploring a variety of possible interventions, such as building flood protection around substations, raising plants above the ground and relocating substations [22]. This results in a prioritisation of substations for investment in protective measures, though that prioritisation is sensitive to estimates of the scale of economic impact, so we have undertaken a robustness analysis to illustrate over what range of economic impacts we expect investments in protection to continue to be cost-beneficial.
Analysis of cyber-attacks to infrastructure networks are even more challenging, because the consequences of the attack need to not be geographically coherent. In an analysis of the potential consequences of cyber-attacks to electricity substation infrastructure [23] a number of different threat scenarios, including simultaneous cyber-attacks on the same type of hardware located at several dispersed locations across eastern England were analysed to identify the potential scale of disruption and hence help to inform prioritisation of protective measures.
Future directions
The demands for infrastructure system-of-systems modelling and analysis are growing rapidly and at the same time capabilities are quickly evolving. Since embarking on the ITRC programme we have seen several dedicated infrastructure units being established in countries around the world, including the National Infrastructure Commission in the UK. We are receiving a growing number of enquiries for organisations in national governments and at sub-national levels to apply evidence-based methodology for infrastructure assessment and prioritisation. Alongside the proliferation of national infrastructure initiatives [24] there is a growing amount of interest in strategic infrastructure provision at sub-national scales, notably for large cities and city-regions. This reflects the devolution of powers, for example for transport planning, and the increasing recognition of infrastructure quality and resilience as attributes of competitiveness [25]. These sub-national studies provide the opportunity to look in greater depth at infrastructure interdependencies. However, they also present more challenging ‘boundary problems’ of characterising the interactions between a city and its hinterland and neighbours. The boundaries of cities vary depending on the criterion used (e.g. legal jurisdiction, population density, % of workforce commuting to the city centre). Cities depend upon their hinterlands for water, energy and other resources. All of these issues present challenges for integrated infrastructure assessment at a city or regional scale.
In this article we have separated consideration of infrastructure interdependencies in long-term planning of infrastructure from their role in analysis of the risks of infrastructure failure. This separation reflects the different methodological approaches that we have adopted in our ITRC research programme, but they are converging in significant respects. We have already acknowledged that reliability is one of the main attributes of the quality of an infrastructure service. Mention of reliability naturally prompts questions about the circumstances in which infrastructure fails to deliver the requisite level of service, which our methodologies for analysis of risk and resilience are designed to answer. These methodologies are becoming increasingly sophisticated in their representation of the processes that are enacted on networks e.g. transport rerouting during times of disruption, which involves the same tools as we are using for transport planning in NISMOD2. Thus we see a convergence of analysis of interdependent infrastructure systems, which operates on a continuum from every-day operating conditions through to major disruption in the most catastrophic events. Moreover, resilience and adaptability to climate change are increasingly being seen as critical attributes of infrastructure plans. Thus long-term planning and management of risks to infrastructure are increasingly converging.
Acquiring the data upon infrastructure networks, the processes that are enacted on those networks and the people and businesses that they serve are key obstacles in infrastructure systems analysis. We have painstakingly managed to assemble infrastructure data for all of Great Britain and have growing coverage of infrastructure networks around the world. Big datasets, such as OpenStreetMap and night time light observations are rapidly opening up new opportunities for infrastructure systems analysis in data-sparse situations. Datasets from mobile phones (e.g. vehicle tracking data) are providing valuable new insights. So far we have not sought to model systems in real time (or near-real-time), but the sensor and datasets that might make that feasible are rapidly proliferating. This offers the opportunity to extend from simulation modelling and long-term planning problems to shorter-term decisions such as maintenance prioritisation and real-time operational decisions.
All of these developments require increasing computational capabilities, which is why we have made the business case and now received £8 million in new funding for DAFNI: the Data and Analytics Facility for National Infrastructure, which will be based at the Rutherford Appleton Laboratory (RAL) in Harwell, England. DAFNI’s development programme began in 2017 with a planned final delivery in 2021. An overview of DAFNI’s capabilities is presented in Figure 3. The facility combines investment in high performance computation and high volume data storage (alongside other HPC and big data facilities at RAL) with a software platform to provide an environment for simulation modelling that can readily access the datasets stored in the national infrastructure database. Cloud bursting technologies will enable seamless access to commercial cloud computation resources when the in-house hardware capacity is exceeded. The National Infrastructure Modelling Service (NIMS) will deal with the model integration, workflows, uncertainty analysis and optimisation that is currently embedded in NISMOD. New visualisation facilities will enable interaction with modellers and decision makers.