THEMES / ENERGY /
ENERGY SUPPLY
ENERGY SUPPLY
INTRODUCTION
The Energy Supply model is built from ground-up by extending the Combined Gas and Electricity Network Model (CGEN) with integrated local energy systems using the Energy Hub concept.
The Energy Supply model is able to handle interdependencies with the Transport (energy demand and EV battery utilisation for V2G services) and Water Supply (cooling water for thermal power stations) models.
The Energy Hub approach enables:
- combined operation of electricity, natural gas, heat distribution systems.
- exploration of new energy vectors e.g. Hydrogen
- investigation of alternative renewable energy supply options that are available locally e.g. Waste to energy, bio-energy
- modelling of energy demand for transport. e.g. EVs and vehicle to grid schemes.
Additional functions in the Energy Supply model include:
- Bi-directional electricity interconnector flows
- Demand side management (load shifting)
- Intermittent renewable generation which captures spatial and temporal variability
- Distributed injection of hydrogen and biogas into the natural gas distribution system.
- Constrained and optimised heat supply methods that allows the investigation of different future heat supply scenarios/strategies.
ENERGY SUPPLY
RESULTS
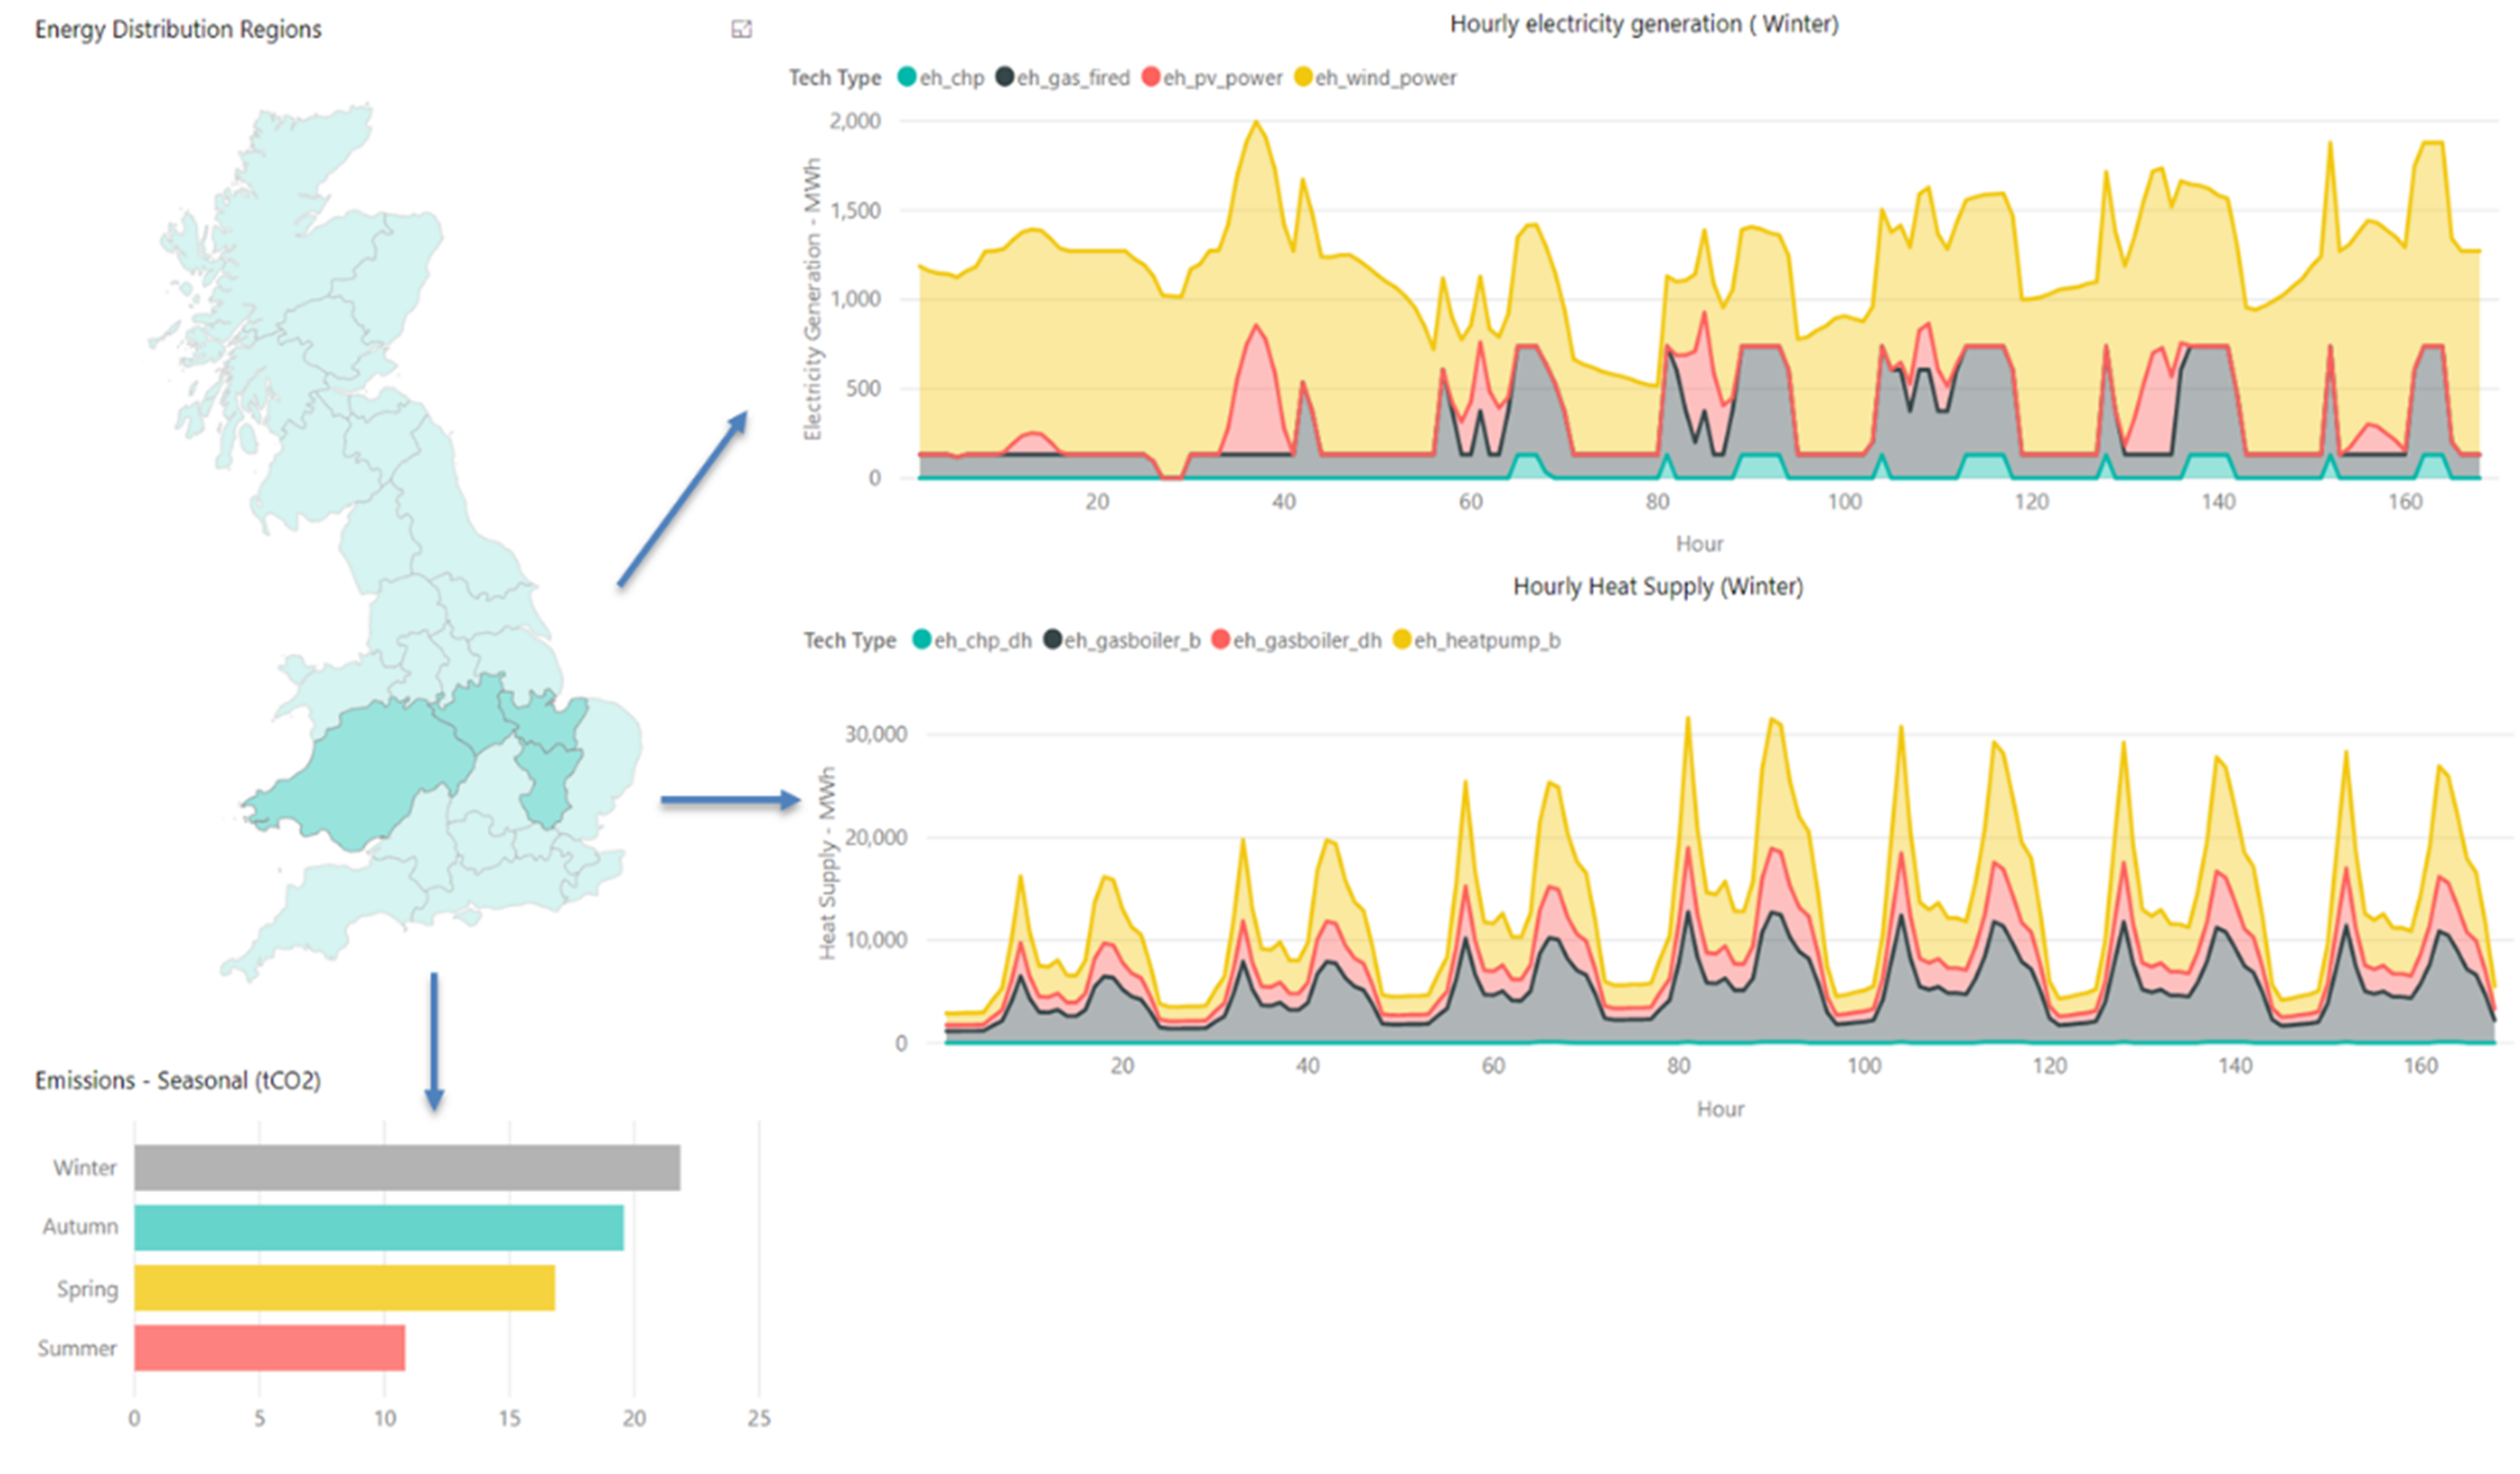
The results can also be presented seasonally – e.g. (bottom left) Emissions from the selected regions per season.

Figure 1: Example local scale outputs – Hourly electricity and heat supply (winter) with seasonal variations in CO2 emissions.

Figure 2: Example distributed generation of electricity.

Figure 3: Example of distributed supply of heat from buildings and district heating technologies.
The operation of these transmission networks take into account of the integrated operation of electricity, natural gas and heat supply systems modelled using Energy Hubs at the local scale.
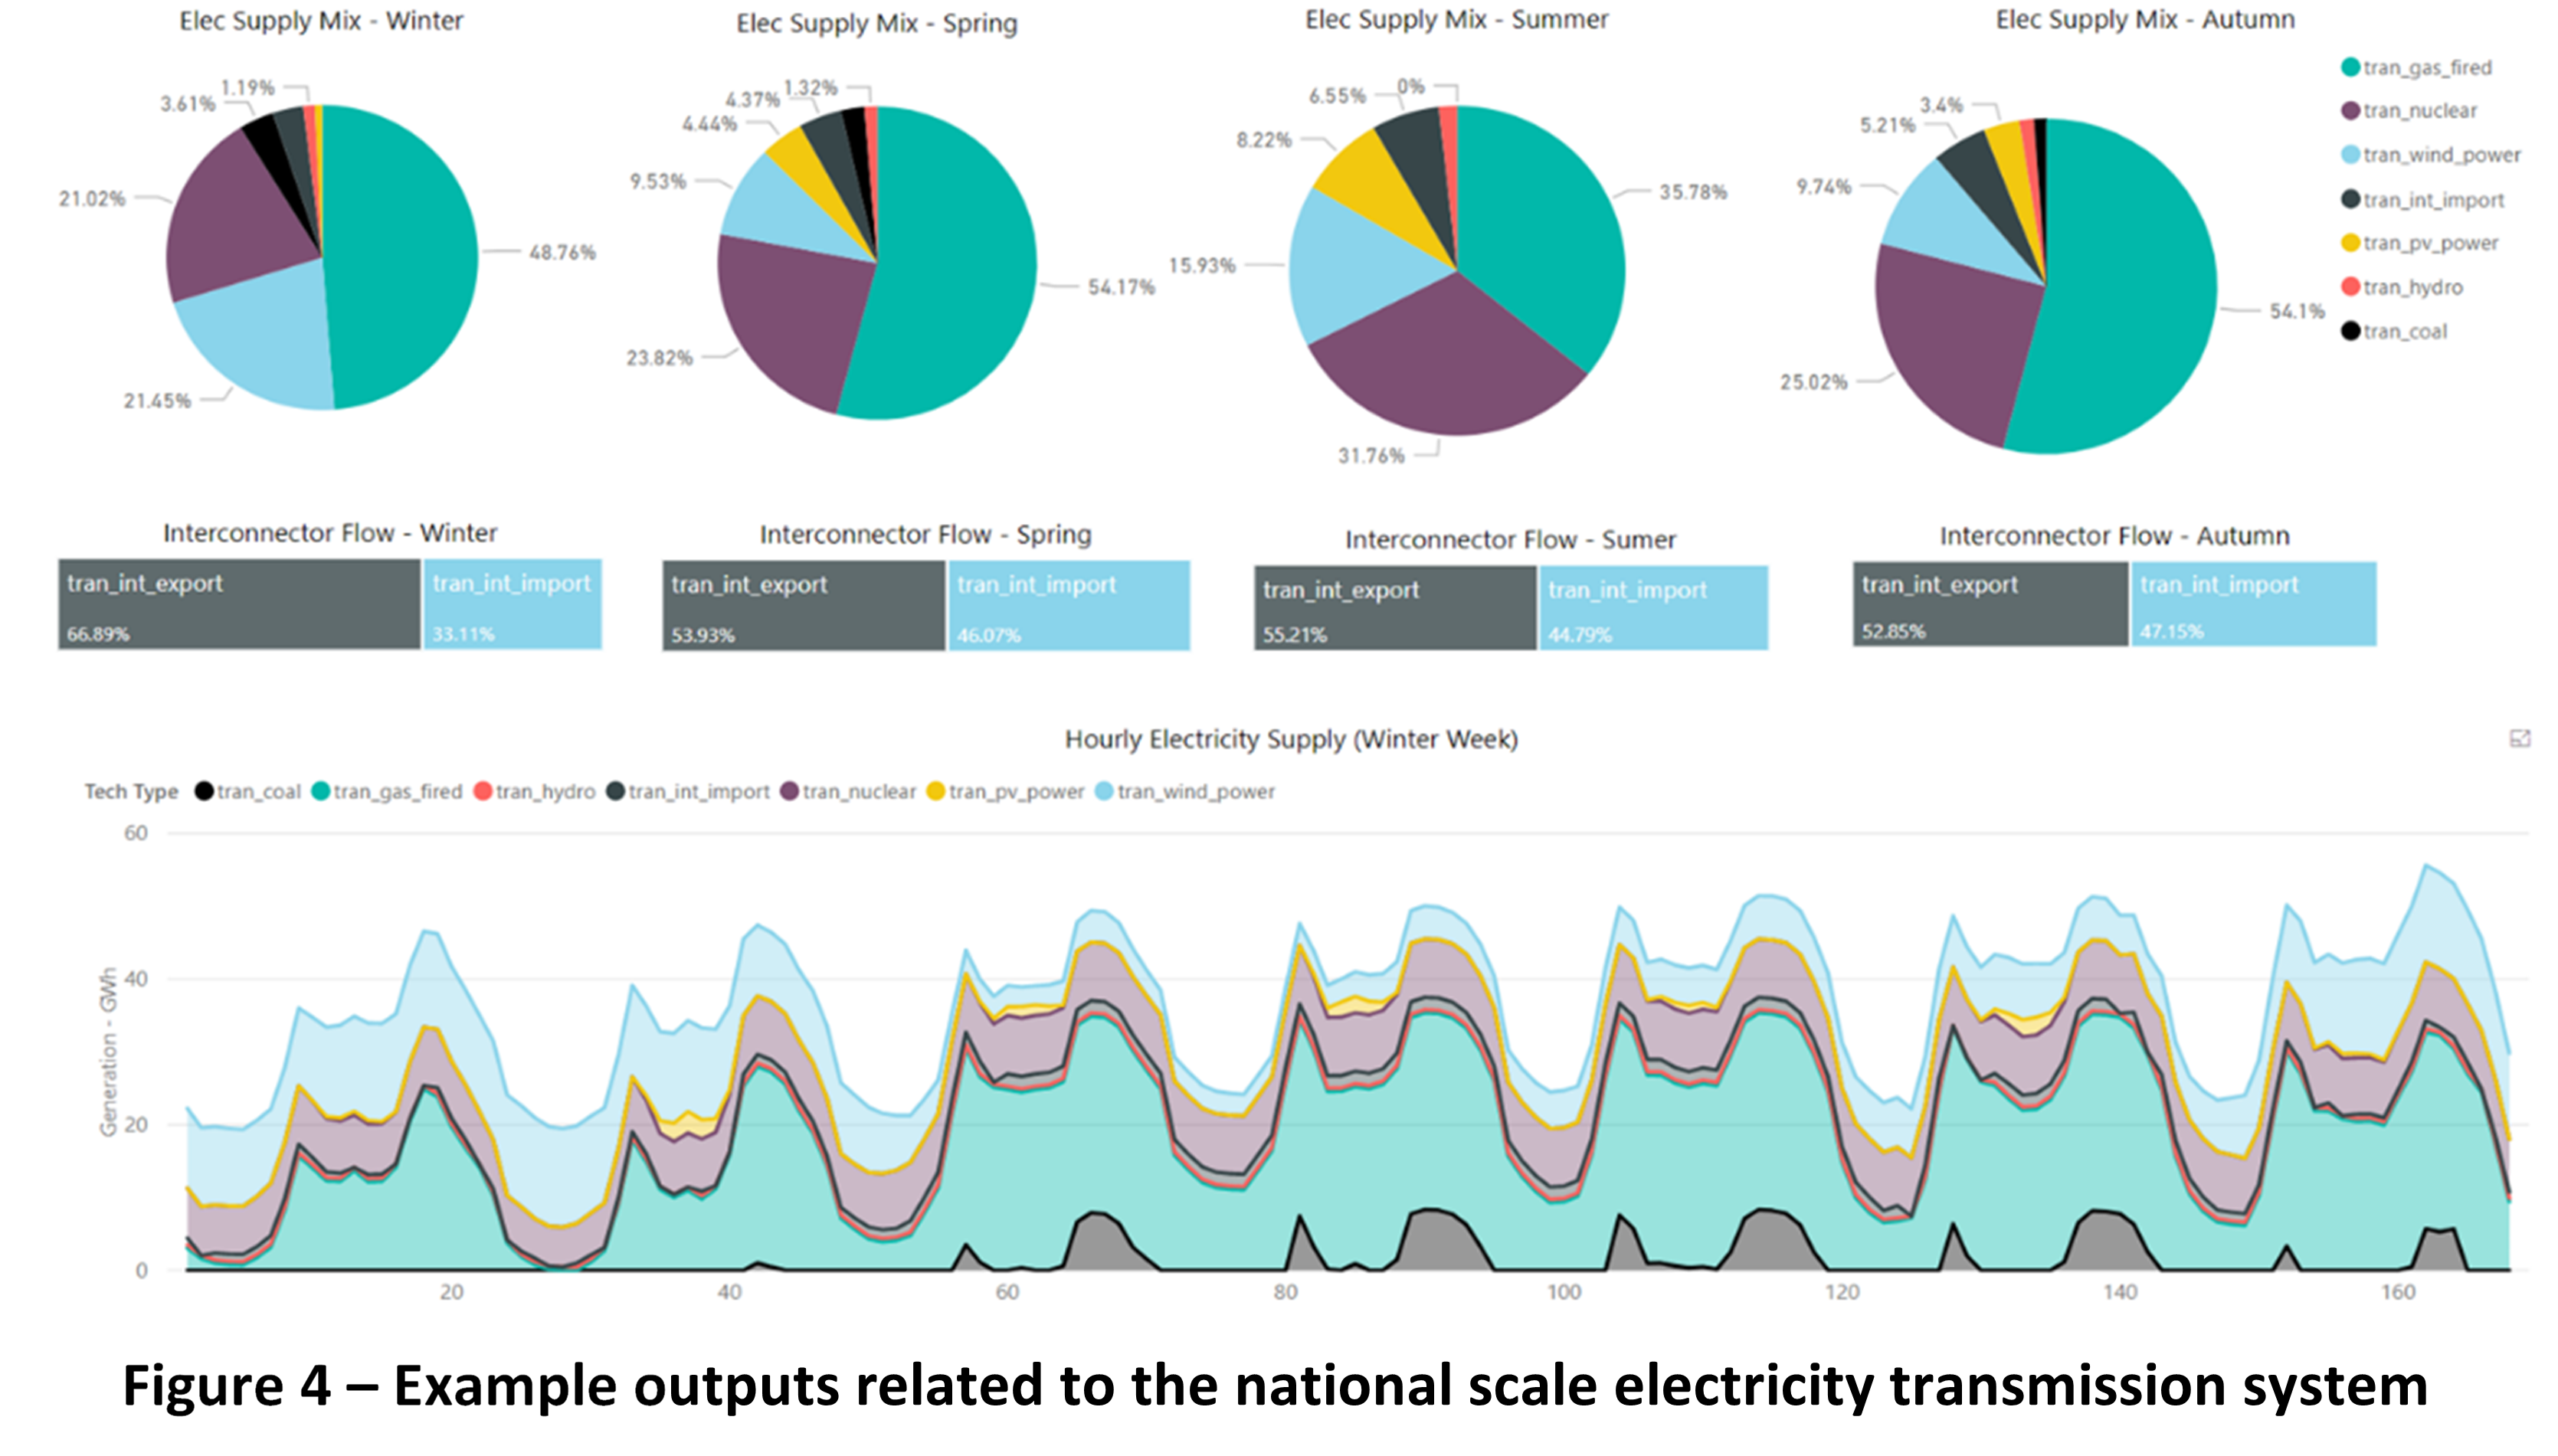
The variations in the electricity supply mix are shown per season (pie charts) in Figure 4. In each season the percentage of electricity interconnector flows (middle bar chart) are shown as imports or exports. The electricity supply by technology is shown in hourly resolution (bottom stacked area chart).

Figure 4: Example outputs related to the national scale electricity transmission system.
ENERGY SUPPLY
PUBLICATIONS
How weather affects energy demand variability in the transition towards sustainable heating
Electrification of heat will impact demands on power systems, potentially increasing sensitivity to weather variability. We have developed a spatio-temporal methodology for assessing electricity ... read more
An analysis of electricity consumption patterns in the water and wastewater sectors in South East England
The water and wastewater sectors of England and Wales (E&W) are energy-intensive. Although E&W’s water sector is of international interest, in particular due to the early experience with ... read more
Predictive mapping of the global power system using open data
Limited data on global power infrastructure makes it difficult to respond to challenges in electricity access and climate change. Although high-voltage data on transmission networks are often ... read more
ENERGY SUPPLY
CASE STUDIES

Low carbon energy supply strategies for the Oxford-Cambridge Arc region
This research was funded by a grant from the UK Engineering and Physical Science Research Council to the ITRCResearch question & scope The energy supply model is utilised to evaluate how ... read more

Cyberattacks on London’s electricity networks costing up to £111m daily
New research shows cyberattacks on London’s electricity networks leads to widespread disruption, costing up to £111m daily. read more